Author Archives: LRF
Your Investing SUCKED in 2022!!! Here’s how to fix it…
For most investors, 2022 is one of those years they’ll be happy to see in the rear view mirror. But, with the Fed still putting the brakes on the economy by way of higher interest rates, the outlook for 2023 isn’t looking much better. Conditions being what they are many investors are left wondering if they should continue to hang on and wait as their accounts decline in value, or if there might be a better option.
With the stock market down nearly 20% as of today, it’s no surprise that investors are concerned. The sage advice that all one has to do is buy a couple of index funds, and hang on for the ride, offers little consolation during a down market. And, while it’s true that the market always comes back, the recovery can sometimes take an awfully long time ̶ years in fact, depending on how far it’s fallen.
Like most people, I used to follow the advice of the supposed experts and doggedly hung on as my retirement accounts imploded. Case in point, when the dot-com bubble burst I lost over 50% in my 401k. Later, I watched the same thing happen again when my IRA fell nearly 40% following the housing market collapse. But, with the experts saying the stock market always comes back I continued to hang on.
Suffice it to say, for most of my years of saving and investing I was a staunch proponent of buying a fund that tracked the passive S&P 500 index and never selling. But, that started to change back in 2013 when it occurred to me that perhaps much of the S&P 500 index’s growth might be due to everyone following the same advice. I knew from simple economics that when a lot of people are buying the same item it drives the price up. This got me thinking that with everyone buying S&P 500 index funds just like we’ve been told to do maybe that was one of the main drivers behind its meteoric growth in recent years. The realization that the stock market rising might be due in part to a self-fulfilling prophecy had me wondering what would happen if everyone got nervous and started selling at the same time. Could all those folks simultaneously selling result in prices declining even farther than was justified? Basic economics said it could.
For a time, I’d been including dividend companies as a means to generate more income for several retired clients when I began to notice that on days when the stock market was declining the dividend companies seemed to fare better, generally falling far less than the low-cost S&P 500 index fund I was using as the foundation in all of my client’s portfolios. It had me wondering how a portfolio comprised solely of dividend companies might perform against the index. Finally, in the spring of 2019, I sold all of the funds in my IRA and built a portfolio comprised solely of dividend companies. I then began to monitor the movement of the dozen or so companies against the S&P 500 index.
As I waited to see what would happen, I decided to work on a screening tool for selecting dividend companies. I knew if my portfolio of dividend companies performed as I expected it would, I’d have no choice but to introduce the concept to the public. As a starting point, I considered the companies in the S&P 500 Index. I knew that the S&P 500 Index is a collection of the 500+/- largest U.S. companies and that when buying an S&P 500 index fund, the investor is simply acquiring portions of all of the companies represented by the index. But, aside from the more obvious companies like Google and Amazon, I really knew little about most of the other companies in the index. I decided to take an in-depth look. What stood out almost immediately was just how lopsided the index is.
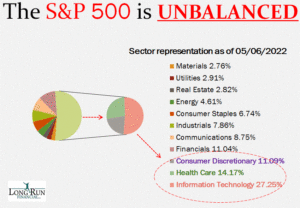
According to Fidelity Investments, the U.S. economy can be broken down into 11 areas, or sectors. These sectors when viewed like slices of a pizza come in various sizes. The reason for this is two-fold. First, the sectors are comprised of different numbers of companies. Second, those companies come in all sizes. So, here’s a juicy little tidbit that most investors are unaware of. The S&P 500 index is a cap-weighted index. “Cap”, or capitalization, refers to the size of a company. The larger a company’s size (capitalization), the larger it’s representation (weighting) in the index. The implications of this are that the largest companies in the S&P 500 index have a significant impact on its return while the smallest have almost no impact. And, that’s just for starters. Further compounding the situation is that several of the largest companies in the index come from the same few sectors. This concentration in both size and sector had me thinking that S&P 500 index funds aren’t nearly as diversified as I’d been led to believe. I suspected this condition meant that only a few companies and sectors might be responsible for most of the indexes long-term return. See below for breakdown as of 5/6/22.
Additionally, remember how when everyone is buying the same thing it drives up the price? Well, many of the biggest companies are that way for a reason. Those that sell the hottest products, like Apple Inc. for instance are among the most popular which means nearly everyone buys their products. And, since everyone is buying their products, investors too pile onto the bandwagon buying up shares of the company and driving up the price. I concluded that popularity is largely responsible for the compounded size and thus the over-sized representation of certain companies in the S&P 500 index. And, then there’s another contributing factor. In addition to the passive index fund managers who are compelled to buy their shares, both active fund managers and individual investors alike are also buying the shares of those companies and further driving up the price.
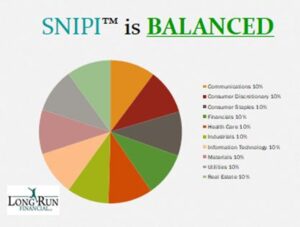
My theory about popularity leading to outsized company growth and sector size led me to consider what would happen if a few of those companies fell out of favor whether due to a misstep on management’s part or even as a result of a normal stock market pullback. I suspected just as their oversized weightings were responsible for magnifying the returns of the S&P 500 index when it was going up, those same inflated weightings would exaggerate negative index returns during stock market pullbacks. It was then I came up with the radical question of what might happen if I assembled a blended portfolio of (mostly) lesser known companies and gave equal representation to each of the economic sectors.
I’d already seen how individual dividend companies performed on a day-to-day basis and was curious to know how a market-neutral portfolio would perform against the S&P 500 index. Surely, it would experience lower price swings. If so, how would it impact a portfolio’s returns over time?
In creating this market-neutral portfolio I decided to limit the selection of companies to those that pay dividends. My purpose for doing this was to enhance the income being produced by the portfolio, and additionally to reduce my own bias for certain sectors or the popular growth companies found in the S&P 500 index. As I set about researching companies and fine-tuning the portfolio through back-testing I decided to take the radical step of excluding all companies from the energy sector. See breakdown below.
The reason for the removal of energy is that from a historic standpoint, the energy sector appears bipolar and generates a wide dispersion of annual returns. As I expected the removal of the energy sector did indeed result in a significant dampening of portfolio volatility and subsequently this caused it to produce more consistent returns. What I hadn’t anticipated was just how much that lower volatility might enhance the return of the portfolio.
Fast forward to the present and the results are speaking for themselves. Since, creating that first all dividend company portfolio, I’ve transitioned all but the very smallest of my client’s accounts to this form of investing. Not only that, I’ve developed a stock screening formula that has reduced the universe of companies to a field of less than two hundred qualified candidates. I’m hesitant to share all the ingredients of my recipe, but let’s just say Sector Neutral Income Portfolio Investing or SNIPI™ as I’ve named the process generates returns consistent with what my testing had shown.
The importance of SNIPI™ neutrality cannot be overstated. That’s because with each stock market pullback SNIPI™ falls far less than the S&P 500 Index.
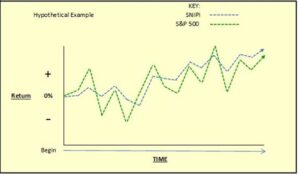
The result is a portfolio which remains in a much stronger position than the S&P 500 Index each time the stock market starts to rise again. The implications are SNIPI™ more readily regains what was lost and returns to a positive return more quickly than the S&P 500 index. The lower decline and more rapid recovery each time means that SNIPI™ doesn’t need to produce those outsized gains required by investors that rely on the return of the S&P 500 index. And, because the trend is repeated with each market cycle, subsequent downturns cause the SNIPI™ lead to increase still further resulting in a higher average annual return despite not always beating the market over shorter periods of time.
Happy Investing,
Dennis Gravitt AFC® CFP®
Tune in next month to see the actual 2022 SNIPI™ returns experienced by my clients
Economic Bubbles Always Burst, are we in one?
Bubbles always burst, are we in one?
04/18/2022
It goes without saying that bubbles are prone to bursting and those experienced in the economy are no exception. The difficulty, however, lies in identifying economic bubbles and positioning one’s investments so as not to get burned when the bubble pops. Thankfully, previous clues left behind from previous bubbles have been identified by author and Yale Professor Vikram Mansharamani whose 2010 book “Boombustology – Spotting Financial Bubbles before They Burst” points out several common characteristics he’s compiled from those earlier bubbles. Among these characteristics are easy access to credit, cheap money through low interest rates, conspicuous consumption and belief that this time it’s different, supply and demand manipulation, a willingness to pay more without regard to actual value, and celebrities and influencers touting some new idea, along with others. Combining these identifiers with my own observations of what’s going on today, I’ll attempt to show areas which I suggest indicate we are presently experiencing an economic bubble. Before pointing them out, let’s see how we got here in the first place.
Our present economic cycle began after the collapse of the housing market bubble which led to the Great Recession and a subsequent sell-off of the U.S. stock market. When it was all said and done, the result was an S&P 500 decline of -37% at the end of 2008. In its effort to kick-start the economy the U.S. government embarked on an extensive period of low interest rates. Next, over a decade into these lower rates, it indiscriminately pushed stimulus money into the system by mailing checks to every citizen and most any business with a claim, and then initiated a protracted period of providing unemployment dollars to displaced workers as the country progressed through the pandemic caused shutdown. Today, we are living with the results of those government actions which include economic activity of epic proportions and which recently have led to the beginning of a series of interest rate hikes in 2022. Just how overheated might the economy be is perhaps subject to interpretation. What follows is a list of indicators which I believe show that we are far into an economic bubble and it may be about to pop.
Perhaps the most convincing indicator is today’s housing market. Existing home’s which previously might be on the market for several weeks or longer are selling in a single day with bids often coming in at well over the asking price. Back in the fall of 2020, my wife and I experienced the phenomenon when after living in our home for nearly 26 years we decided to look for a new residence. More often than not, the houses we looked at would sell that very day disallowing us the opportunity to think things over and resulting in a frustrating experience. Later, when we were selling our own house, we had eight appointments quickly scheduled for the opening day which led to two bids above our asking price and a sale to the second bidder when the first fell through. Regarding the prices which people are willing to pay for existing houses, the average national increase for 2021 alone was 18.8%. For this year, they are expected to increase another 16.4%.
Next, there’s the automobile chip shortage which resulted in backorders for certain automobiles which need the chip for their completion. While under normal circumstances, some eager buyers would grow frustrated and move on to other vehicles there’s been such a frenzy to obtain these vehicles consumers seem to be willing to pay just about any price. The fervor has reached such proportions that car dealerships are calling present owners of the hottest vehicles and offering them thousands of dollars above the retail price previously paid. Of note is these cars are then resold at such prices they absorb not only the retail price the dealer paid the previous owner but the commission the dealer has to earn to make the transaction worth his while. Noteworthy of mentioning is the fact that automobiles, under normal circumstances, are depreciating assets meaning they decline in value with each passing year.
Another indicator is the advent of free stock trading, low or no account minimums, and the ability to purchase partial shares for those who can’t afford the full purchase price of a single share of certain companies which has led to droves of amateur investors joining the fray. The rising presence of amateurs in an activity is often indicative of a bubble. Known as the “Reddit crowd” this group of mostly younger investors often join together to drive up the cost of their favorite companies regardless of the underlying value. On occasion the crowd’s activity has served even to disrupt normal stock market activities when it comes to buying and selling. Today there’s even a term for a company which has grown popular with the crowd through social media. It’s called a “meme stock”. Meme stock prices are mostly driven by their popularity among inexperienced investors with little regard to their actual worth.
Then, there’s crypto currency. Buy-in for devotees has resulted in a price per Bitcoin increase from a $911 close on January 2, 2017 to $39,857.62 at the end of the day on April 11, 2022. While that rise in value has been nothing short of fantasy, it should be noted that Bitcoin had previously reached a valuation of $65,466.84 at the end of the day on November 8, 2021. Note: I’m not saying crypto currency isn’t here to stay, but a 4,375x increase in just over 5 years and 3 months appears suspiciously like a bubble.
Other possible indicators include two other phenomena the SPAC and, most recently the NFT. According to Investopedia, a SPAC or “Special Purpose Acquisition Company, is a company that has no commercial operations and is formed strictly to raise capital through an initial public offering (IPO) for the purpose of acquiring or merging with an existing company”. While in 2021 there were 613 SPAC IPOs, only 59 SPACs came to market in 2019 for an increase of over 10 xs in just two years. Previously unknown to the common investor, these short-term entities are now available to the general public. As in other instances where something new has been introduced folks have flocked to SPACs in an effort to get in on the ground floor. Of note, however, is that SPACs are also known as “blank check companies”. The reason for this is that investors aren’t given notice before investing of just what the company will be investing in. Investopedia goes on to say “an investor in a SPAC IPO is making a leap of faith that its promoters will be successful in acquiring or merging with a suitable target company in the future”, and “that retail (amateur) investors run the risk of being saddled with an investment that could be massively overhyped or occasionally fraudulent”.
For the NFT or, non-fungible token I offer Wikipedia’s description verbatim: “The non-fungible token (NFT) is a non-interchangeable unit of data stored on a blockchain, a form of digital ledger, that can be sold and traded. Types of NFT data units may be associated with digital files such as photos, videos, and audio”. Meanwhile, …”NFT ledgers claim to provide a public certificate of authenticity or proof of ownership, but the legal rights conveyed by an NFT can be uncertain. NFTs do not restrict the sharing or copying of the underlying digital files, do not necessarily convey the copyright of the digital files, and do not prevent the creation of NFTs with identical associated files.” “NFTs…have drawn increasing criticism for the energy cost and carbon footprint associated with validating blockchain transactions as well as their frequent use in art scams. The NFT market has been compared to a Ponzi scheme”.
So much speculation, in this author’s opinion, points toward trouble. That’s because, when the credit fueling the previous bubbles began to dry up it tended to slow speculation. In every instance a decline in speculation resulted in earlier entrants being financially squeezed and unable to unload their speculative holdings. Consequently, this caused them to grow increasingly willing to sell at lower and lower prices until eventually there was a fire-sale which caused prices to fall ever farther. Finally, when the bubble burst no one wanted to buy the speculative product. I was only after much time had passed and all of the fluff had been shaken out, that things gradually returned to normal and the cycle began once more.
While forecasting when an economic bubble is going to burst is folly recognizing the signs of exaggerated speculation in different areas of the economy is quite another matter. With irrational signs everywhere, investing in today’s environment calls for prudent investing. The collective stock market remains at an extremely high valuation despite the recent volatility and, at some point stock prices will inevitably fall in response to the slowing economy. My response to stock market investing whether the market is up, down or about to fall is the same. When it comes to stock investing portfolios should be positioned to accommodate any economic condition. At Long Run Financial, Ltd., my investment portfolios are designed to do just that. That’s because I build portfolios with a market-neutral approach regardless of which direction the stock market appears to be headed.
I call it Sector Neutral Income Portfolio Investing or, SNIPI™ for short. To learn more about SNIPI™ and how it can protect your assets when the market pulls back go to LongRunFinancial.com. Discover what the SNIPI™ investor knows, while you can’t predict what’s going to happen, SNIPI™s market-neutral stance provides growth in the good times and protection when the bubble bursts.
Sincerely,
Dennis Gravitt AFC®, CFP®, President
President, Long Run Financial, Ltd.